Join Today
INSIDE THE NUMBERS: Team Offense
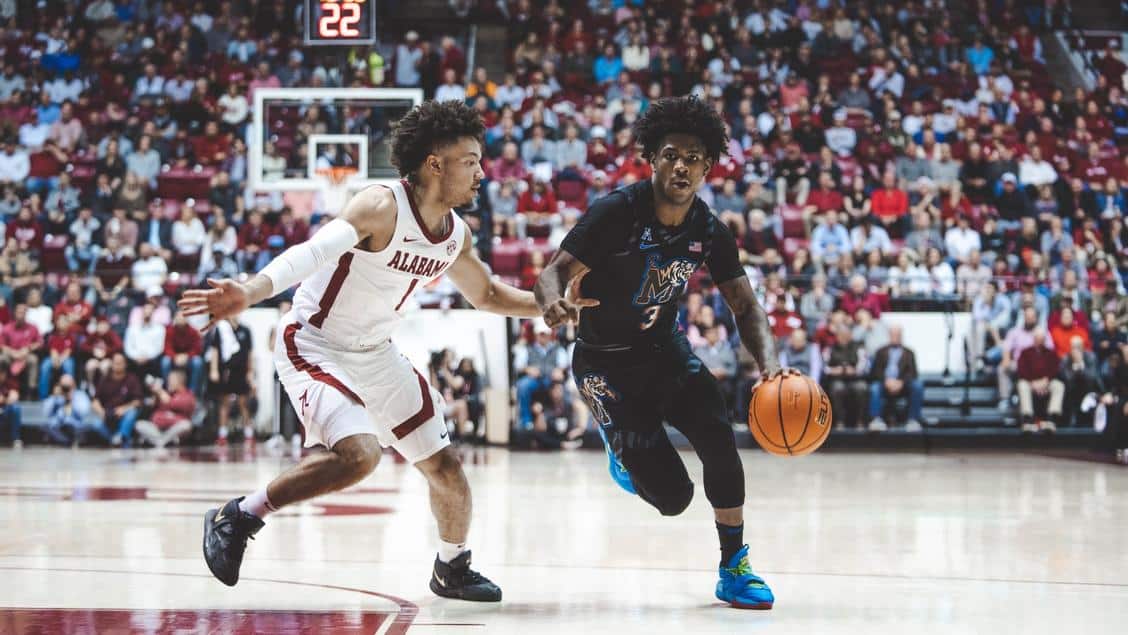
This is the first article in a series that will attempt to take you inside University of Memphis analytics. On a semi-regular basis, we will take a deeper dive into the metrics of a specific area in Tigers athletics. If you’re a stats freak, we hope you enjoy this; feel free to leave tweets, comments and message board posts on the website including suggestions or requests. If you’re not a numbers person, you may want to have a bottle of aspirin nearby, or just skip to the summary at the bottom.
Today let’s look at overall team offense for the men’s basketball team. This team is averaging a strong 78.1 points per game – good for 59th in the country. It is the second highest PPG since the 2008 Final Four team, with only Hardaway’s first team scoring more (80.1 ppg) during that timeframe. Adjusted Offensive Efficiency is a metric that measures points scored per 100 possessions. The Tigers rank 54th in this metric. Once again, this is the second highest the Tigers have ranked in over a decade. So how are they scoring?
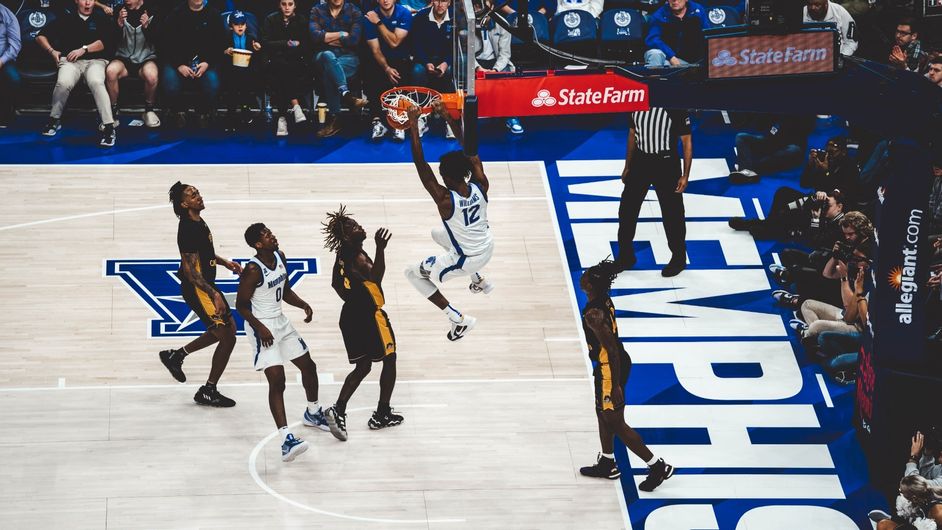
The current field goal percentage is 47 percent – the 62nd highest nationally and the highest Tigers rate in nine years. However, the three-point percentage is only 32 percent – which is 284th in the country and the second lowest Tigers team in 23 years. These two rates combine in advanced analytics to give an effective field goal metric of 51.3 which ranks 120th – which is top third of all teams, but not exactly high level. So shooting is a mixed bag, and conversion percentage alone is not driving the improved scoring.
It is interesting to see where the Tigers are focusing their offensive efforts. The table below uses four categories for shot attempts (based upon distance from the goal), and the percent of shots taken (not necessarily made) in each category. Alongside the shooting splits are the national rankings for the Tigers in the four categories, and also Houston’s splits for benchmarking purposes:
| Memphis | rank | Houston | |
| Dunks | 7.7% | 10 | 7.6% |
| Other “close” 2-point shots | 34.9% | 112 | 25.0% |
| Longer distance 2-point shots | 30.4% | 81 | 32.6% |
| 3-point shots | 27.0% | 354 | 34.8% |
| 100.0% | 100.0% |
That is a unique shot selection profile – top 10 nationally in dunks and bottom 10 in three-point shots. Also interesting is that other than dunks – which are high for both teams – Memphis’s shot distribution is the inverse of Houston’s. The table gives some insight as to the Tigers’ offensive gameplan. And given that the Tigers are not shooting at a high percentage from deep this year, it likely indicates a smart and successfully executed strategy.
One area that has been a concern for Tigers teams of the past is free throws, and this team is better than most. These Tigers shoot a lot of free throws – largely as a result of the offensive strategy discussed above (and the tempo discussed below). The team averages 21 free throw attempts (FTA) per game, which is 48th in the country. And the Tigers are making FT’s at 72 percent clip. Now that percentage is only middle of the pack nationally, but it is the third highest Tigers FT percentage in 30 years. Free Throw Rate is an advanced metric that factors in FT shooting percentage with the number of possessions. This team is 88th in the country in FTR – which is top quartile, but does not solely explain the top 50ish offense. Which leads us to tempo.
Adjusted Tempo measures the number of possessions per 40 minutes versus an average tempo team. The Tigers’ AdjT metric is 71.9 which is 25th nationally. To be clear, this is not the fastest tempo in the Hardaway era; he coached faster tempos his first two seasons. But it is a fast tempo versus the rest of the country, and leads to some higher metrics if turnover numbers are kept down.
The team averages 13.7 turnovers per game. That is only good for a ranking of 264th – but it is the lowest number of the Hardaway era. Moreover, the TO % (factoring in tempo) is 18.6 percent which is in the top half of the country, and easily the best season in seven years.
SUMMARY
This team is borderline top-50 in offense and has some of the highest metrics in the last decade of Tigers basketball. They operate at a high tempo and have reduced turnovers as compared to recent years. This leads to one of the highest scoring teams since the Calipari era. The team is not effective from three-point range, and it recognizes that by limiting the number of attempts from long range. Instead, the team opts for higher percentage close-to-the-basket shots, and is top 10 in frequency of dunks. The work in the paint allows the team to get to the free throw line more than most, and the improved free throw shooting this year has increased their effectiveness in this area.
Share
You can subscribe to more Insider content to get even more Memphis Grizzlies and Memphis Tigers coverage here.
Bluff City Media now covers every sport in the city of Memphis. Follow our Tigers, Grizzlies, and Soccer coverage on Twitter.
Follow Bluff City Media on Instagram and TikTok - and subscribe to our Bluff City Media YouTube Channel.
Make sure you check out all our podcasts that focus on Grizzlies, Tigers, Soccer, and more!
The Daily Grind Ep. 272: Slipping and Solidifying

Night At The Museum | Golden State Warriors @ Memphis Grizzlies Live Postgame Show | Grizz 901

Georgia Tech forward Duncan Powell to visit Memphis basketball
The Daily Grind Ep. 271: GAME DAY—Golden State Warriors @ Memphis Grizzlies

Night At The Museum | Golden State Warriors @ Memphis Grizzlies Live Postgame Show | Grizz 901


